 English (India)
 Español
 Português
 Français
 Deutsch
 Italiano
 العربية
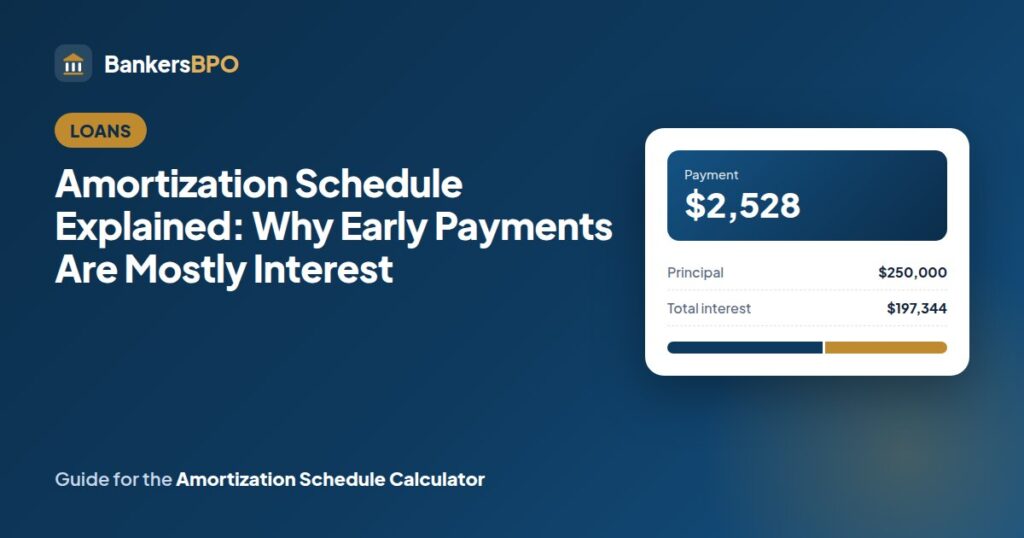
An amortization schedule explained properly answers the question every borrower asks after a year of payments: “I have paid $22,000, so why has my balance only gone down by $6,000?” The answer is in the table, and once you can read it you can see exactly where every dollar of every payment goes. Build one for your own loan in the amortization schedule calculator and follow along; the example below is a $250,000 mortgage at 6.5% over 20 years, with a principal-and-interest payment of $1,864.
What the schedule shows
An amortization schedule is a list of every payment on a loan, from the first to the last, with four numbers per row: the interest charged that month, the principal repaid, the payment (which is the two added together), and the balance left afterwards. Lenders include one with the closing package or show it in the servicer’s online account, and the tool on this site produces the same table from the amount, rate and term.
Because fixed-rate loans charge interest on the outstanding balance, interest in any month is the balance at the start of that month multiplied by the monthly rate. At 6.5% a year the monthly rate is 0.54167%. The payment is fixed, so principal repaid is whatever is left after interest. That single rule generates the whole table.
The first row
Month 1 opens with the full $250,000 outstanding. Interest is 250,000 × 0.0054167 = $1,354. The payment is $1,864, so the principal part is $510 and the closing balance is $249,490.
Month 2 opens with $249,490. Interest falls to $1,351, principal rises to $513, and the balance closes at $248,977. The interest fell by $3 and the principal rose by $3. Every row does the same thing: a little less interest, a little more principal, same payment. The amounts shift slowly at first because the balance barely moves, and faster later because by then each payment takes a bigger bite.
Year by year
Grouping the rows by year makes the shape obvious. These are the yearly totals from the tool for the example loan.
| Year | Interest paid | Principal paid | Balance at year end |
|---|---|---|---|
| 1 | $16,064 | $6,303 | $243,697 |
| 2 | $15,642 | $6,725 | $236,972 |
| 5 | $14,199 | $8,169 | $213,973 |
| 10 | $11,072 | $11,296 | $164,154 |
| 12 | $9,508 | $12,859 | $139,243 |
| 15 | $6,747 | $15,620 | $95,263 |
| 20 | $768 | $21,599 | $0 |
In year one, 72% of what you pay is interest. After five years, $112,000 has gone out and the balance has dropped by $36,000. The crossover, where a month’s principal first exceeds its interest, comes in month 113, more than nine years in. In the final year, 97% of each payment is principal.
This is why a borrower who sells the house after four years finds the loan nearly intact, and why extra payments early in the loan save so much more than the same amount later.
Why the split is lopsided
Nothing is being hidden; it is arithmetic. Interest is proportional to the balance, and the balance is largest at the start. A fixed payment has to cover that large interest first, leaving little for principal. As principal shrinks the balance, interest shrinks, and the payment’s fixed size means the difference flows to principal. The curve is steep at the end for the same reason it is flat at the beginning.
A shorter term flattens the curve. On a 10-year term the payment is $2,839 and the first month’s principal is $1,485, more than half the payment, against a little over a quarter on the 20-year loan. Total interest falls from $197,344 to $90,644. The schedule shows this trade-off more vividly than the payment alone, which is why it is worth looking at before choosing a term in the loan payment calculator.
Reading the yearly view in the tool
The tool’s yearly view adds a column most servicer schedules leave out: the share of the loan repaid at the end of each year. On the example loan it reads 3% after year one, 14% after year five, 34% after year ten and 62% after year fifteen. Two practical uses:
- Deciding on an extra payment. The share repaid tells you how much of the interest is still ahead of you. With 66% of the loan unpaid after ten years, a lump sum still saves a great deal; at 90% repaid, it saves little. The extra payment calculator puts a number on it.
- Deciding on a refinance. The same logic applies. Late in the loan, the interest left is small, and a lower rate on it saves less than the closing costs.
The monthly view is for matching the servicer’s statement line by line, and the CSV download gives you the same table in a spreadsheet for your own records.
What changes the schedule after it is printed
The schedule in your closing package is a forecast. Three things redraw it.
A rate adjustment on an ARM. When the index resets, interest in every future row changes and the payment is recalculated on the remaining balance and term. After an adjustment, download a fresh schedule from the servicer or rebuild it in the tool with the new rate.
An extra payment. The balance drops at once. Unless you ask for a recast, the payment stays the same and the loan simply ends sooner: fewer rows, same payment. With a recast, the payment falls and the rows stay. Either way the interest in every later row falls.
A missed or late payment. Interest accrues on the unpaid balance, a late fee is added, and the schedule slips. One missed payment early in a 30-year loan adds more than one month to the end, because the interest on the missed principal compounds through the remaining rows.
Common misreadings
“The lender is front-loading interest.” It is not, in the sense of charging more interest than the rate implies. Each month’s interest is exactly the rate on that month’s balance. The front-loading is a consequence of a fixed payment, and a lender using a different method, say a fixed principal each month with falling payments, would charge the same total interest for the same balances.
“The interest column is what I will pay in total.” Only if you keep the loan to the last row. Sell, prepay or refinance, and the interest in the rows after that point never gets paid.
“The balance is what I would pay to close the loan.” Close, but not exact. The payoff figure also includes interest accrued since the last payment date and any fees, which is why the servicer issues a payoff statement with the precise amount and a good-through date.
Building your own
Open the amortization schedule calculator, enter the amount, rate and term from your closing disclosure and the month of your first payment. Switch to the monthly view and compare the first few rows with your statement; if the interest matches, the rate is right. Then switch to the yearly view and look at the share repaid at the point you might prepay, sell or refinance. Other calculators, including the refinance tool, are on the homepage.
FAQs
What is the difference between an amortization schedule and a payment schedule?
Nothing in practice. Servicers usually say “payment schedule” or “loan schedule”; “amortization schedule” is the general finance term. Both list every payment with its interest, principal and closing balance. Some servicer versions leave out the yearly totals and the share repaid, which the tool adds.
Why does the servicer’s schedule show a slightly different balance after a year?
Usually because the servicer computes interest on actual days or applies payments on the date received rather than the due date. Over a year the difference is a few dollars. A larger gap means a rate adjustment, a late payment, or a fee added to the balance, so check the statement for those.
Does an extra payment change past rows in the schedule?
No. Past rows record what was actually charged and paid. An extra payment changes the opening balance of the next row, and every row after it is recalculated. The tool shows the effect as a new schedule from the current balance, not a rewrite of history.
Does the schedule include taxes, insurance and PMI?
No. Those are escrow items collected with the payment but not part of the loan. The schedule covers principal and interest only. Enter the principal-and-interest figure from your closing disclosure, not the total monthly payment, when you compare the tool with your statement.
Why do the first-year interest totals matter for taxes?
Mortgage interest on a primary or second home is deductible if you itemize, on loan balances up to the current IRS limit, and the servicer reports the year’s interest on Form 1098. The yearly view gives the same figure. On the example loan, year-one interest is $16,064; whether itemizing beats the standard deduction depends on your other deductions.
Is the schedule the same for a car loan or personal loan?
Yes, if the loan is a simple-interest amortizing loan, which bank and credit union car loans and personal loans are. The curve is less extreme because terms are shorter. Loans quoted at an add-on rate do not follow this schedule at all; the add-on rate to APR converter shows what they really cost.