 English (India)
 Español
 Português
 Français
 Deutsch
 Italiano
 العربية
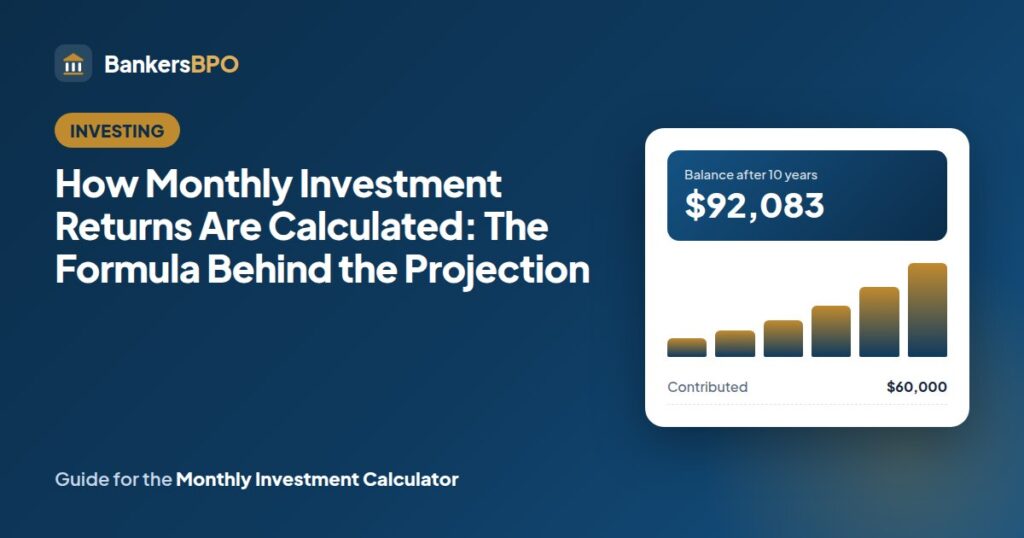
Every projection of a monthly investing plan, from a brokerage’s retirement tool to the monthly investment calculator on this site, runs the same formula. Knowing how monthly investment returns are calculated lets you check any projection, see which assumption is doing the work, and understand why the return on your actual statement will be a different number from the one you typed in. This guide works the formula on $500 a month at 8% over ten years, then explains the three returns that get called “the return”.
The formula
Future value = D × ((1 + i)^n − 1) ÷ i × (1 + i)
- D is the monthly contribution.
- i is the monthly return: the annual rate divided by 12 and 100. An 8% assumption gives i = 0.006667.
- n is the number of contributions.
The final (1 + i) assumes each contribution goes in at the start of the month and earns that month’s growth. This is the future value of an annuity due, the same math a savings plan uses, with a market return in place of a bank rate.
For $500 a month at 8% over 120 months: (1.006667)^120 = 2.2196; (2.2196 − 1) ÷ 0.006667 = 182.95; × 500 = 91,474; × 1.006667 = $92,083. Contributions total $60,000, so the projected gain is $32,083.
Each contribution on its own
As with a savings plan, the clearest picture comes from treating every deposit separately. The first $500 compounds for 120 months and grows to $1,110. The deposit made at month 60 compounds for 60 months and grows to $745. The last one grows to $503. Add up 120 of these and you get $92,083.
That is why the gain is $32,083 rather than the $73,178 that $60,000 invested as a lump sum at 8% would have earned over the same ten years. On average the money has been invested for five years, not ten. It is also why the second decade of a plan produces so much more than the first: by then the early deposits have had twenty years of compounding.
| Horizon | Contributed | Value at 8% | Gain |
|---|---|---|---|
| 10 years | $60,000 | $92,083 | $32,083 |
| 20 years | $120,000 | $296,474 | $176,474 |
| 30 years | $180,000 | $750,148 | $570,148 |
The third decade adds $454,000 on $60,000 of new money. Nothing about the formula changed; the early deposits simply kept compounding.
The assumption that does the work
The rate. Everything else in the formula is a fact (how much, how long); the rate is a guess about the future. At 6% the ten-year figure is $82,349; at 10% it is $103,276. Over thirty years the range is $505,000 to $1,140,000 for the same $180,000 of contributions. The monthly investment calculator exists partly so you can see this spread rather than one number.
A reasonable range for a diversified stock portfolio, before inflation and after low index-fund fees, is 6 to 8%. The long-run US stock average is about 10% before inflation and 7% after; using 10% ignores inflation, fees and the possibility that the next thirty years are worse than the last ninety. Treat 8% as optimistic and 6% as the planning case.
Why the projection is smooth and reality is not
The formula applies 8% every month. Real returns arrive as −20% one year, +25% the next, +10% the year after. The final balance depends on the order of the returns as well as their average, because contributions made just before a drop buy at high prices and contributions made just after buy cheaply.
Two ten-year sequences with roughly the same average illustrate it. Nine years of 8% followed by a −5% year gives $80,063. A −5% year first, followed by nine years of 8%, gives $89,801. The bad year costs $10,000 more when it comes last, because by then the balance is large. This is sequence risk, and it is the reason to move a plan toward safer assets in its final years. For a plan still in its first decade, early drops are mild and even helpful: the monthly contributions buy more shares.
The three returns on your statement
When you look at an actual account after a few years, the “return” is one of three different numbers.
The assumed return is what you put in the calculator. It is the rate the plan would have needed to produce the balance if returns had been constant.
The time-weighted return is what the fund reports in its fact sheet. It measures the fund’s performance as if a single dollar had been invested at the start, with no deposits or withdrawals. It is the right number for comparing funds and the wrong number for your account, because your money was not all there at the start.
The money-weighted return, which brokerages label “personal rate of return” or compute as an IRR, is the rate that makes your actual deposits, on their actual dates, grow to your actual balance. It is the only one that describes your experience, and it differs from the fund’s return whenever the market moved while you were still contributing. If the fund rose mostly in its early years, before most of your money arrived, your personal return is lower than the fund’s; if it rose late, yours is higher.
When your statement shows 6.5% and the fund shows 9%, nothing is wrong. The formula on this page is the money-weighted view, run forward with a constant assumption.
Checking a projection someone gives you
Take the monthly amount, the horizon and the rate from the projection and put them into the formula or the calculator. If the result matches, the projection is honest arithmetic and the only question is whether the rate is reasonable. If it is higher than the formula gives, look for a contribution increase, an employer match or a lump sum folded in without being labelled. If it is lower, a fee or an inflation adjustment has been applied, which is fine as long as it says so.
Fees, taxes and inflation are outside the formula
The rate you enter should already be net of fund fees; an index fund at 0.05% a year takes almost nothing, a 1% fee turns 8% into 7%. Taxes depend on the account: none until withdrawal in a 401(k) or traditional IRA, none at all in a Roth if the rules are met, and capital gains tax on sale in a taxable account. Inflation reduces what the final figure buys; $92,083 in ten years at 3% inflation buys what $68,500 buys today. The calculator reports nominal dollars; subtract roughly 3% from the rate to see the result in today’s money.
Using the projection well
Enter your contribution and horizon in the monthly investment calculator and run it at 6%, 8% and 10%. Plan on the 6% result, hope for the 8%, and treat the 10% as a reminder of how much the assumption matters. If the plan includes raising the contribution each year, the guide on increasing contributions each year shows what that does. For the same deposits in a guaranteed account, the savings plan calculator gives the floor to compare against, and for a yearly retirement contribution the retirement savings calculator compounds annually instead of monthly. All the tools are on the homepage.
FAQs
Does the formula assume reinvested dividends?
Yes. The rate is a total return, which includes dividends reinvested into more shares. If you take dividends as cash, the growth rate of the account is lower by the dividend yield, about 1.5 to 2% a year for a broad US stock fund, and the formula should use that lower rate.
Should I use the annual rate divided by 12, or the twelfth root?
Dividing by 12 is the convention in calculators and matches how savings rates are quoted; it compounds to slightly more than the annual rate. The twelfth root of (1 + annual rate) compounds to exactly the annual rate. On $500 a month at 8% over ten years the two differ by about $1,400. The calculator divides by 12.
Why does my brokerage’s projection show a different number?
Different assumptions: a different rate, end-of-month rather than start-of-month contributions, annual rather than monthly compounding, a fee deducted, or inflation adjustment. Any of these shifts the result by a few percent. If you can match the inputs, the formula gives the same answer, because it is the same formula.
How do I calculate my own return from a statement?
Use a spreadsheet’s XIRR function with each contribution as a negative cash flow on its date and the current balance as a positive one today. The result is your money-weighted annual return. Brokerages that show a “personal rate of return” are doing the same calculation.
Does a bad first year ruin the plan?
No, and it often helps. A 20% drop in year one of a ten-year plan, followed by average years, ends only a few percent below a smooth projection, because the early contributions bought at low prices. A bad final year hurts far more, which is why the last years of a plan belong in safer assets.
What is a realistic return for a bond-heavy portfolio?
Around 4 to 5% for a mix dominated by investment-grade bonds, close to what a savings account or CD ladder pays in a normal rate environment. Bonds add some growth and some risk of loss when rates rise; for a short-horizon goal, compare against the guaranteed savings figure before taking that risk.